Thermal Simulation of Power Transformers
Power transformers are electrical devices used to increase or decrease the alternating voltages in electric power applications, and are essential for the transmission, distribution, and utilization of alternating current electrical energy.
The lifetime of a power transformer depends largely on the temperature of its insulation and the common cellulosic-based insulating parts of its windings are typically the most thermal stressed structures. The heat generated within power transformers is usually removed by circulating a cooling fluid, typically mineral oil, through a complex set of interconnected ducts. The geometrical configuration of the ducts determines the oil flow distribution along the transformer, which affects the heat removal efficiency and the position and magnitude of the hot-spots (maximum temperature locations). To avoid experimental verification every time a new power transformer is designed, modelling and simulation of hydrodynamics and heat transfer within the cooling circuit are essential to ensure the control of temperature inside the power transformer, including the magnitude and position of hot-spots and average temperatures of the oil and conductor discs at different positions.
In this work, two methods are used to model the cooling of a power transformer: Computational Fluid Dynamics (CFD) and Thermal-Hydraulic Network Models (THNM). CFD was used for the detailed modelling and simulation and to obtain correlations for the friction factor and heat transfer coefficients. The THNM concept implies a division of the spatial domain into a network of smaller and simple elements. The global model comprises two separate models: the hydraulic model; and the thermal model. The hydraulic model describes the oil flow distribution through the network of ducts and junctions, and the flow through the network is modelled using the analogy with an equivalent electric circuit. The heating of the oil throughout the coils due to energy dissipation on the discs is solved by coupling the thermal model that includes all the heat transfer mechanisms, with the hydraulic model.
This work was done in collaboration with and funded by EFACEC.
FluCORE – Thermal Modelling and Simulation of Core-Type Power Transformers
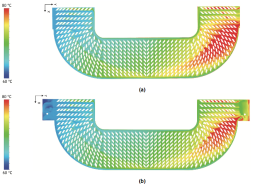
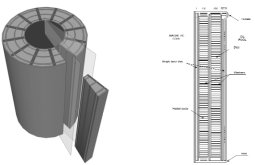
A core-type power transformer comprises a magnetic iron core surrounded by different kind of windings. These windings consist on a conductor wire usually made of insulated copper placed concentrically along the axial direction of the power transformer, forming conductor discs. In this work, a core-type power transformer design has been studied. For each phase, vertical and radial positioned obstacles (sticks and key spacers, respectively) divide the transformer into 12 sections. Since these sections are identical, each section can be considered as a repetitive slice, and used for simultaneous flow and heat transfer modelling simulations. Each phase involves four windings: two disc-type windings, Low Voltage (LV) and High Voltage (HV); and two layer-type windings, Tertiary (T) and Regulation (Reg).
To access the full transport details, 2D and 3D CFD simulation models have been created, representing the smallest repetitive section of the transformer (volume limited by two vertical). The THNM approach enabled the development of a lumped parameter thermal simulation tool named FluCORE. The global model comprises a hydraulic network model, HNM, and a thermal network model, TNM. FluCORE manages these two coupled models in an iterative method, to obtain the final steady-state temperature and velocity fields inside the windings of a core type power transformer.
FluSHELL – Thermal Modelling and Simulation of Shell-Type Power Transformers
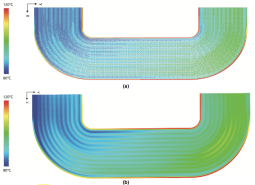
In a shell-type power transformer the magnetic core encloses the windings. The coils in these transformers are rectangular-shaped, and usually on both sides of the coil (generally made of copper) there is a washer made of pressboard with pressboard spacers (trapezoidal shaped in this work). The volume and cross section area between the pressboard washer and the copper coil define the ducts through which the oil flows.
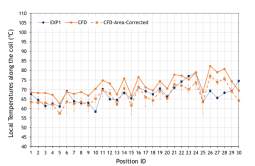
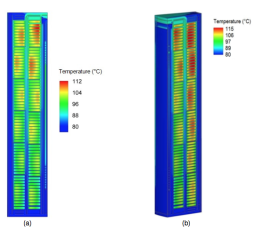
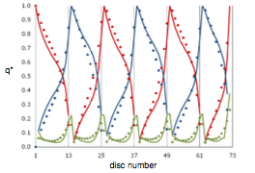
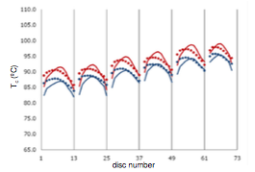
In this work, a novel thermal-hydraulic network simulation tool has been developed for shell-type windings – the FluSHELL tool. Comparison against simulations on a commercial Computational Fluid Dynamics (CFD) code reveals equivalent degrees of accuracy and detail. FluSHELL shows average accuracies of 1.8 ˚C and 2.4 ˚C for the average and maximum temperatures, respectively, and the locations of the maximum winding temperatures have been consistently well predicted. The fluid mass flow rate and pressure distributions show similar trends and can be both predicted with average deviations of 20%. Similarly to CFD, this has been accomplished by discretizing the calculation domain into sets of smaller interconnected elements, but FluSHELL is circa 100 times faster than a comparable CFD simulation.
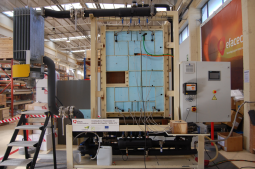
To prove this concept an experimental setup has been designed, constructed and tested. The setup represents the closed cooling loop of a shell-type winding, and due to its operation under DC conditions, it provides means to complement the measurements of local temperatures with accurate measurements of the average temperatures. Experimental validation showed predictions with the same trends and with average accuracies on the same order of magnitude of the combined uncertainties associated with the measurements.